Home  
Online Store  
2022 Game Programs  
Online Registration  
ALB Player Indemnification Form  
Legacy Photography Order Form  
Open Your Heart  
Contact Info  
2024 Printable Schedule (NEW!)  
2023 BGovs Tourney Info  

2023 Printable Roster

 
2023 Online Schedule/Results  
2023 Online Roster  
Coaching History  

College Players

 
Professional Players  

All Time Stats Leaders


Brad Hetland Award


Bismarck Municipal Ballpark

 
Municipal Ballpark Masterplan  
Municipal Ballpark Pledge Form  

NDALB Website


Class "AA" Team Info


Class "AA" Statewide Standings

 
Class "AA" Statewide Schedule  
Reps/Scarlets/Senators Baseball  
Class "A" League Standings  
Class "A" League Schedule  

Baseball - Babe Ruth, Ages 13-15


Souvenir Programs


Archive

 
Be Sun Savvy  

State Tournament History


West Division Tournament History


History of American Legion Baseball

 
NDALB Hall of Fame Inductees  
Loyd Spetz  
BGovs State Championships  
BGovs Regional Tournament History  
ALB Pitch Count  
Connect with BGovs on Facebook  
Connect with BGovs on Twitter  
BISMARCK WEATHER  
 

 2006 Season Statistics

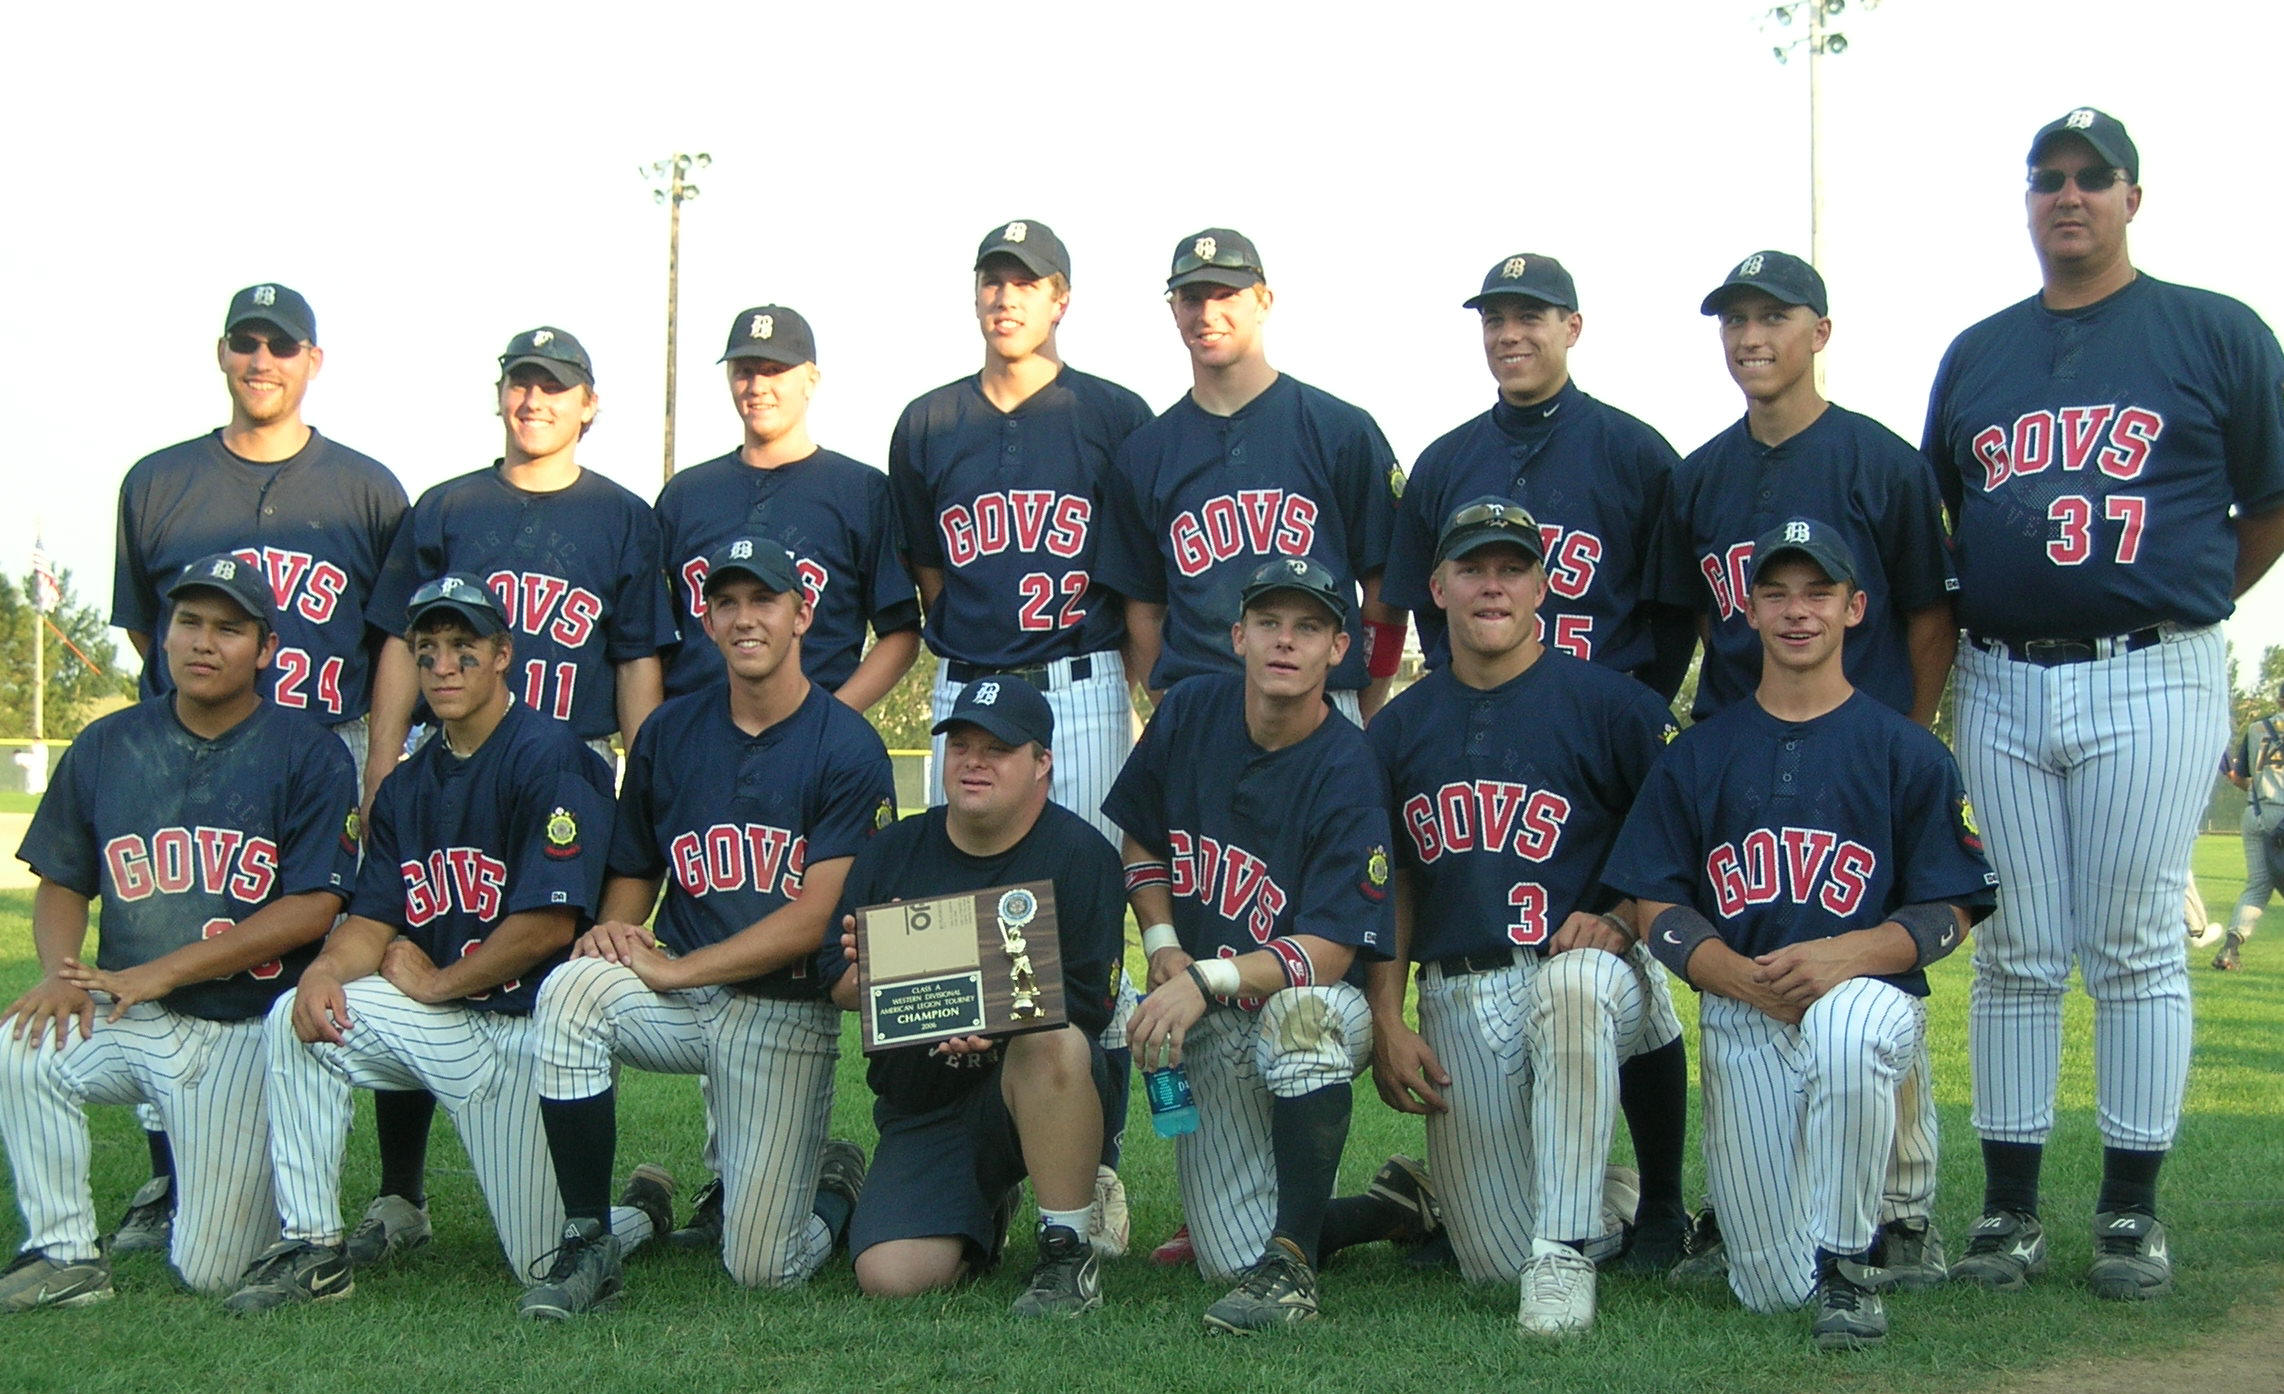
2006 Bismarck Governors Baseball

Western Divisional Tournament Champion

3rd Place - ND American Legion State Class A Tournament

Judge James A. Wright Sportsmanship Award Winner

10-9 West Division, 31-20 Overall

Front Row (L to R): Josh Standing Elk, Dustin Wenzel, Torey Bohan, Batboy Ryan Suchy, Tim Jallen, Justin Connell, and Cody Erhardt. Back Row (L to R): Assistant Coach Blaine Steiner, Daniel Eichele, Matt Loomis, John Fraase, Zach Wentz, Brandon Solemsaas, Matt Kranzler, and Head Coach Mike Skytland. Photo courtesy of Taylor Erhardt.


TEAM: Batting Report

Player # AB R H 2B 3B HR RBI TBB Avg Slg Obp. HP SB Sacf SO CS SB% TB
Josh Standing Elk 35 130 26 53 6 0 0 33 11 408 454 463 5 1 3 14 0 1000 59

Dustin Wenzel

34 150 39 45 9 1 3 32 15 300 433 398 10 9 1 21 2 818 65

Brandon Solemsaas

25 10 1 2 0 1 0 0 0 200 400 200 0 0 0 8 0 0 4

Jon Hausauer

23 17 3 5 1 0 0 5 3 294 353 381 0 0 1 1 0 0 6

John Fraase

22 100 16 32 7 2 0 14 5 320 430 349 0 3 1 22 1 750 43

Zach Wentz

20 164 41 65 11 1 2 47 15 396 512 474 12 3 3 19 0 1000 84

Tyler Johnson

17 15 6 7 1 0 0 5 2 467 533 579 2 2 0 1 0 1000 8

Daniel Eichele

11 141 22 45 5 1 1 31 16 319 390 399 4 4 2 29 1 800 55

Tim

Jallen

10 153 52 52 11 0 3 42 32 340 471 488 15 11 3 16 2 846 72

Matt Loomis

9 45 9 12 3 0 0 10 9 267 333 411 2 1 0 9 0 1000 15

Torey Bohan

7 149 29 49 9 0 2 36 16 329 430 400 3 2 2 10 2 500 64

Matt Kranzler

5 162 46 56 4 2 1 22 25 346 414 462 10 5 1 12 3 625 67

Cody Erhardt

4 149 45 42 2 0 0 18 16 282 295 416 19 10 1 19 4 714 44

Justin Connell

3 135 26 39 8 1 2 22 9 289 407 359 7 9 2 14 2 818 55

Nathan Schlosser

  3 1 1 0 0 0 0 1 333 333 500 0 0 0 1 0 0 1

Drew Hausauer

  3 1 2 1 0 0 2 1 667 1000 750 0 0 0 1 0 0 3


Total for Team

  1526 363 507 78 9 14 319 176 332 423 427 89 60 20 197 17 779 645

Opponents

  1449 259 445 72 8 25 240 188 307 420 398 41 35 17 213 20 636 608

# - Uniform #, AB - At bats, R - Runs, H - Total hits, 2B - Double, 3B - Triple, HR - Home run, RBI - Runs batted in, TBB - Total walks, Avg - Batting average, Slg - Slugging %, Obp - On base %, HP - Hit by pitch, SB - Stolen base, Sacf - Sacrifice fly, SO - Strike out, CS - Caught stealing, SB% - Stolen base %, TB - Total bases

back to top

TEAM: Fielding Report

Player # Inn PO A EF ET Errors F% 2B-P PB CCS CSB
Josh Standing Elk 35 258 27 80 5 2 7 939 8 0 1 0
Dustin Wenzel 34 324 67 13 4 1 5 941 1 0 0 0
Brandon Solemsaas 25 35 4 5 0 1 1 900 2 0 0 0
Jon Hausauer 23 33 12 15 1 1 2 931 3 0 0 0
John Fraase 22 199 168 3 3 2 5 972 14 0 0 0
Zach Wentz 20 310 71 113 8 7 15 925 16 0 0 0
Tyler Johnson 17 37 5 1 1 0 1 857 0 0 0 0
Daniel Eichele 11 315 85 11 1 0 1 990 0 0 1 0
Tim Jallen 10 299 216 29 5 4 9 965 15 0 0 0
Matt Loomis 9 111 9 23 3 0 3 914 1 0 0 0
Torey Bohan 7 255 161 17 3 1 4 978 0 12 8 12
Matt Kranzler 5 323 81 77 4 2 6 963 18 0 0 0
Cody Erhardt 4 310 64 5 3 0 3 958 1 0 0 0
Justin Connell 3 245 100 32 5 1 6 957 3 6 11 6
Nathan Schlosser   7 2 0 0 0 0 1000 0 0 0 0
Drew Hausauer   7 0 0 0 0 0 0 0 0 0 0
Alex Allen   5 0 1 0 0 0 1000 0 0 0 0
Drew Eichele   5 0 1 1 0 1 500 0 0 1 0
                       
Total for Team   342 1072 426 47 22 69 956 82 18 22 18
Opponents   3086 1064 455 58 55 113 931 71 28 16 28

# - Uniform #, Inn - Innings played, PO - Put outs, A - Assists, EF - Errors fielding, ET - Errors throwing, Errors - Total errors, F% - Fielding %, 2B-P - Double plays, PB - Pass balls, CCS - Caught stealing by catcher, CSB - Stolen base off catcher

back to top

TEAM: Pitching Report

Player # IP #BAT RS ER BB HITS HR W L S AVG ERA CG GS Shut SO

Josh

Standing Elk

35

49.33

240

40

28

12

76

3

3

4

0

357

3.97

3

9

0

22

Dustin Wenzel

34

34.33

167

28

24

25

38

3

3

2

0

290

4.89

2

4

1

14

Brandon Solemsaas

25

26.67

122

13

11

22

25

1

1

0

0

253

2.89

1

5

0

14

Jon Hausauer

23

2.00

10

2

1

1

3

0

1

0

0

333

3.50

0

0

0

1

John Fraase

22

19.67

94

21

15

7

27

4

1

1

0

338

5.34

1

3

0

5

Zach Wentz

20

38.67

168

13

10

19

31

1

6

2

0

218

1.81

0

3

0

49

Tyler Johnson

17

1.00

8

2

2

3

1

0

0

0

1

333

14.00

0

0

0

0

Daniel Eichele

11

37.33

183

27

23

19

52

1

5

1

0

329

4.31

1

8

0

27

Tim Jallen

10

15.00

79

14

13

9

24

2

0

2

1

364

6.07

0

2

0

11

Matt Loomis

9

40.67

184

17

11

19

38

3

5

1

0

244

1.89

4

6

0

30

Torey Bohan

7

5.00

27

3

3

4

8

0

1

0

0

364

4.20

0

0

0

3

Matt Kranzler

5

40.00

196

33

21

20

51

4

2

3

1

317

3.68

4

5

0

19

Cody Erhardt

4

25.00

121

16

12

8

34

1

2

1

0

309

3.36

1

3

0

8

Justin Connell

3

11.00

63

16

12

12

17

1

1

1

0

362

7.64

0

1

0

5

Alex Allen


6.33

32

8

8

4

11

1

0

1

0

423

8.84

0

1

0

3

Drew Eichele


5.33

32

6

4

4

9

0

0

1

0

409

5.25

0

1

0

2


Total for Team   357.33 1726 259 198 188 445 25 31 20 3 308 3.88 17 51 1 213
Opponents   355.33 1823 363 234 176 507 14 20 31 0 332 4.61 21 51 3 197

# - Uniform #, IP - Innings pitched, #BAT - Batters faced, RS - Runs allowed, ER - Earned runs allowed, BB - Walks, HITS - Total hits, HR - Home runs, W - Won, L - Lost, S - Save, AVG - Batting average, ERA - Earned run average, CG - Complete games, GS - Games started, Shut - Shutouts, SO - Total strike outs

back to top